|
|
Extraocular Muscle Scan Analysis |
| Many studies have been performed using the MRI image analysis techniques we introduced ( Miller 1989 ) to estimate extraocular muscle paths, shapes, and sizes, demonstrating, for instance, EOM pulleys (Miller, Demer et al. 1993) and the hypertrophy resulting from bupivacaine injection (Miller, Scott et al. 2013). Unfortunately, some studies have also used the presumptive precision and objectivity of MRI to draw very dubious conclusions. Although no methodology can ensure good science, almost three decades of experience suggest refinements that would generally improve the reliability of quantitative extraocular MRI. Accordingly, we review four aspects of scan analysis necessary for accurate volume estimates and muscle crossections without projection correction, and address some of the errors and biases that can affect MRI quantification. An example of these improved techniques can be found in Miller et al (2013). |
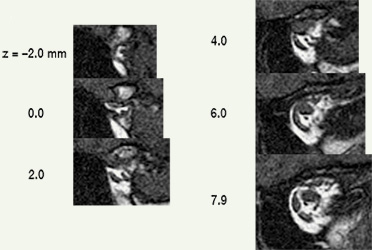
| Analyzing muscles in tomographic images begins by segmenting structures of interest, that is, delineating muscle outlines, and perhaps outlines of other structures. High spatial resolution and high contrast between object and surround are both essential for accurate segmentation. Other things being equal, tightly framing a region of interest (eg, one or both eyes) in the scanner’s field of view maximizes spatial resolution. High contrast is achieved by viewing EOMs against contrasting orbital fat (eg, quasi-coronal sections of rectus muscles), rather than against poorly contrasting globe or optic nerve (eg, saggital sections containing horizontal recti). MRI data is not isotropic. The best spatial resolution, perhaps ⅓ x ⅓ mm, is obtained in scan planes, which are typically separated by about 2 mm. Although a suitable stack of scan planes can be reformatted for viewing at any angle, resolution is lost. Each ⅓ x ⅓ mm pixel in a scan-plane image, then, represents the average MRI signal from a 2 mm thick block of tissue, and if structures of interest change position in the scan plane as they traverse that distance, the result will be a blurry average across affected voxels. Thin slices suffer less from such volume averaging, but provide weaker signals with more noise. Happily, if elongated structures, such as EOMs, are imaged in planes perpendicular to their long axes, there is little structural variation through the thickness of a voxel, and volume averaging contributes only to signal strength. Even where it’s possible to image longitudinal views of a muscle against orbital fat (eg, horizontal recti in transverse section), volume averaging blurs contours and distorts muscle outlines. Quasi-crossectional or quasi-coronal scan planes should therefore always be used for imaging EOMs (eg, Demer & Miller 1999) . Nevertheless, one sees extraocular muscle studies using transverse or saggital sections, under the mistaken assumption that they provide more direct, complete pictures (eg, Lee et al 2007) whereas actually, because of volume averaging, apparent muscle sizes, shapes, and paths are so strongly dependent on thickness and position of slice planes that such images can be uninterpretable. |
[2] Multiple independent segmentations should be obtained.
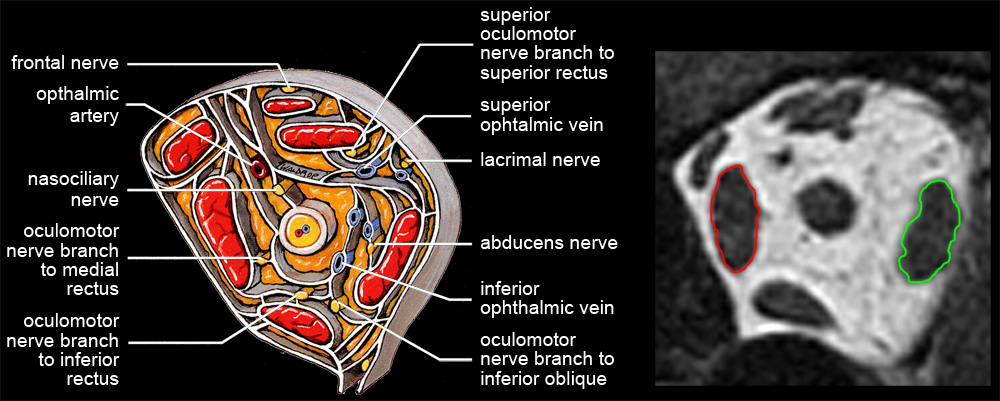 Even with modern scanners and crossectional slice orientation, muscle contours must be delineated manually. Quantifying an MRI scan requires judgment, and it is essential to control operator bias. Nerves, blood vessels, and dense connective tissue bands can distort the apparent outline of a muscle, particularly in the anterior orbit, and it can be helpful to refer to known anatomy (see figure). Except for gross comparisons, it is essential to obtain multiple independent judgments of muscle contours, preferably from readers naive with respect to experimental hypotheses. |
[3] 3D Reconstruction Yields Accurate Volumes & Cross-sections.
 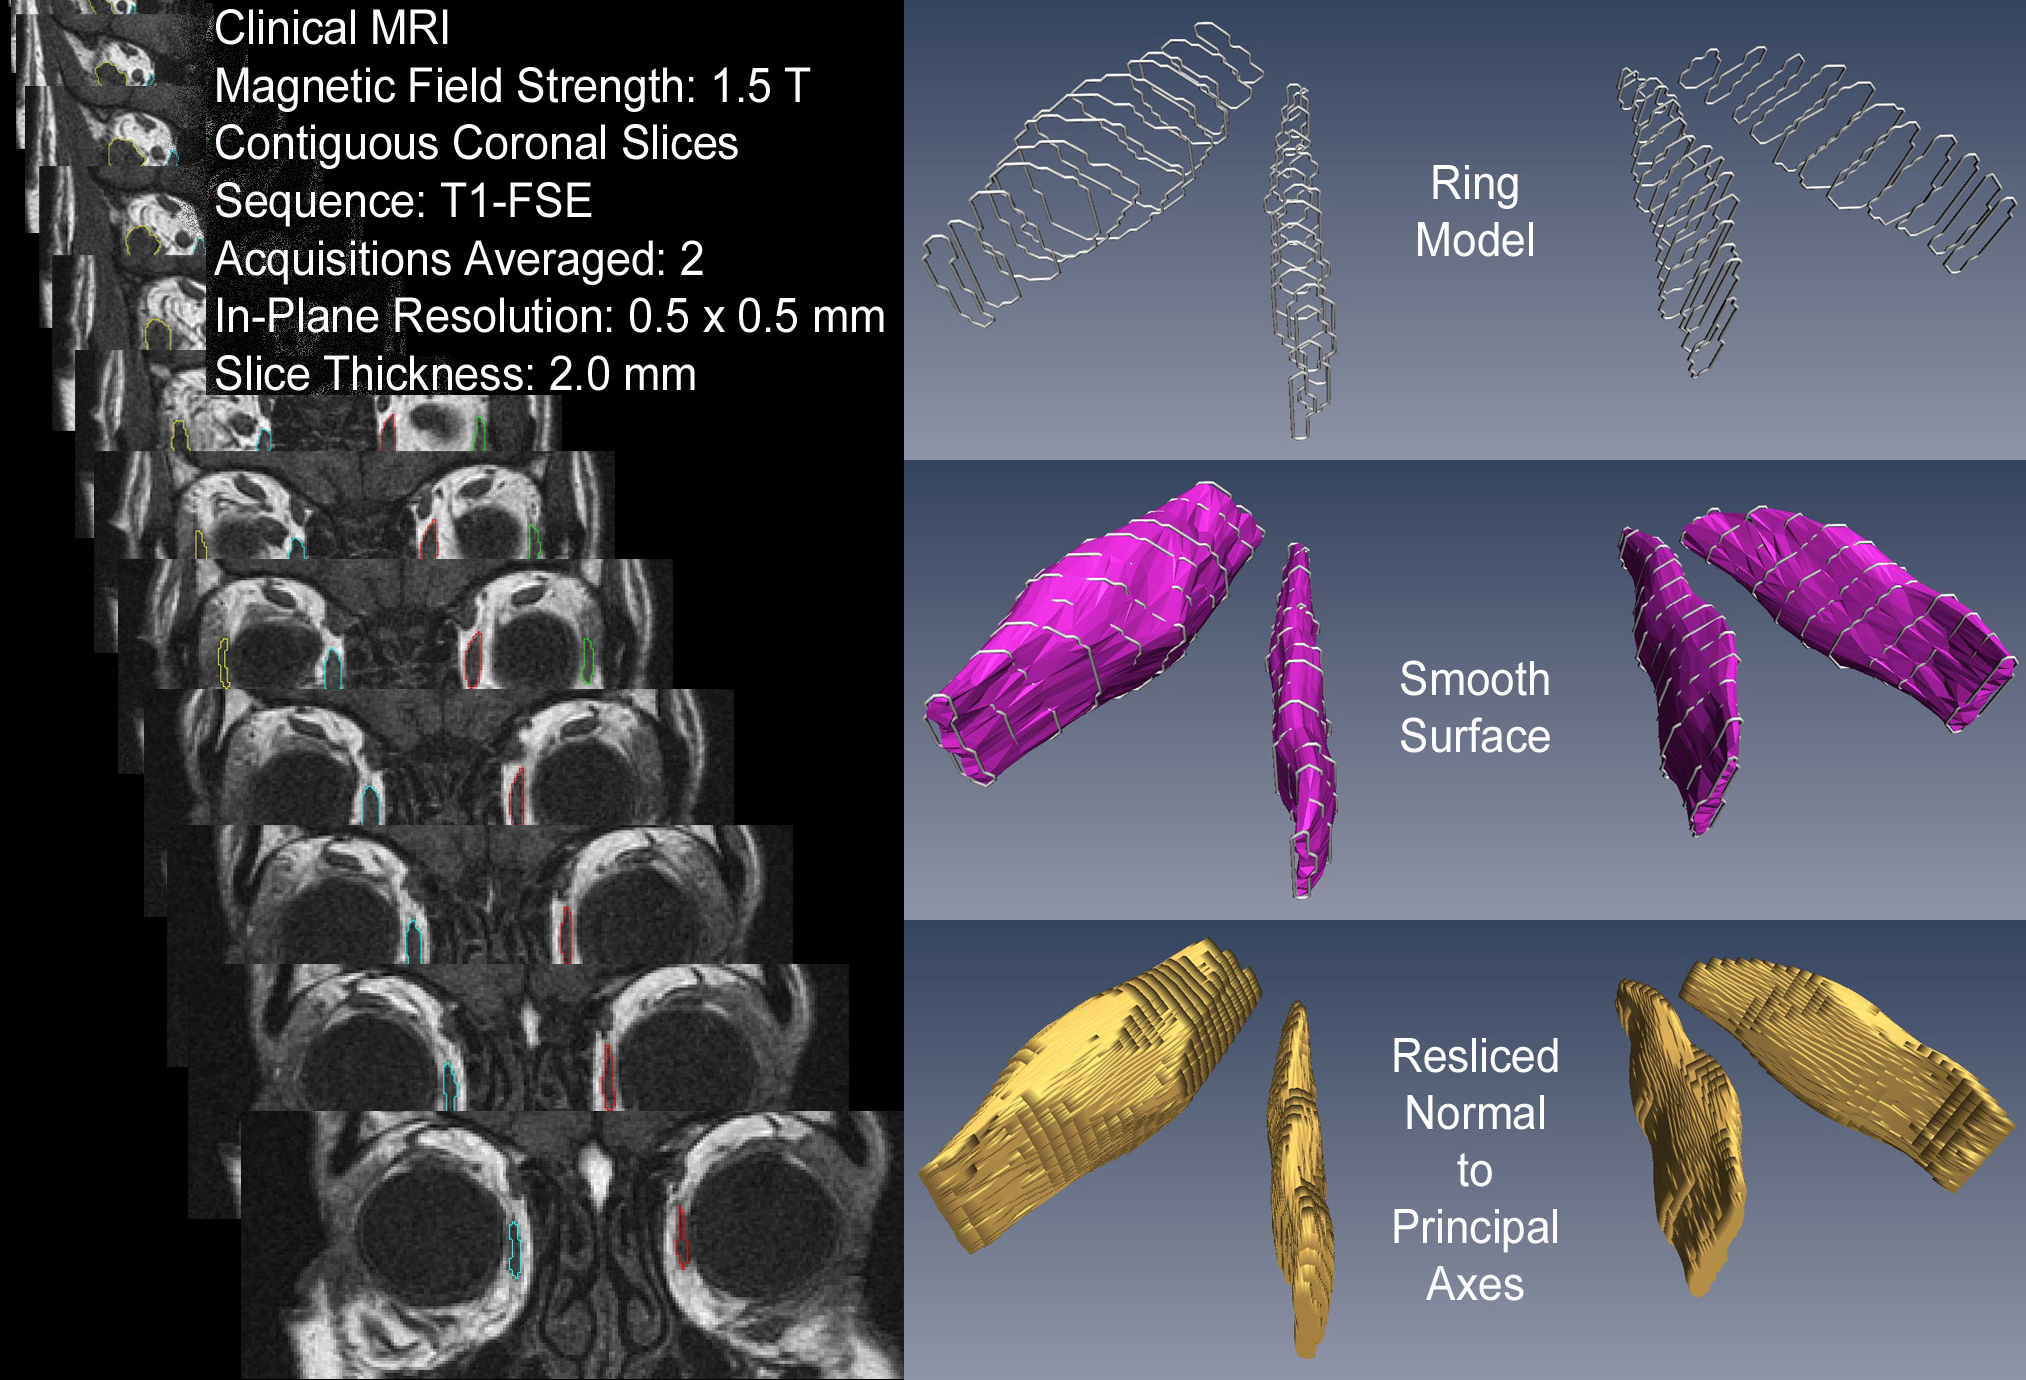
Single crossectional scans, even accurately quantified, are difficult to interpret. A muscle may appear to have increased in volume simply because contraction moved its larger crossection into the chosen scan plane. Better, would be to segment several slices and compare the scans containing the maximum crossections. For a complete picture one must segment the full range of slices. But, if a complete series of scan-plane images is analyzed as "stacked blocks” (as we originally proposed) volumes will have difficult-to-correct errors, and crossectional areas will require projection-angle corrections (see figure). Consequently, unless the effects one is measuring are large enough to survive volume averaging artifacts, projection distortions, volume quantification errors, and slice selection biases, the preferred method for quantifying elongated structures such as extraocular muscles is 3D reconstruction based on multiple quasi-crossectional slices. Techniques for producing a ring model from muscle contours, fitting the ring model with a smooth surface, and then reslicing the surface perpendicular to the muscle's long axis, are straightforward (see figure), and can be performed with many image manipulation packages (eg, Amira from the Visualization Sciences Group of FEI). |
[4] EOM Imaging Should Extend to the Origin.
The origin is the preferred orbital reference. Posterior muscle segments show large changes in crossection with contraction.
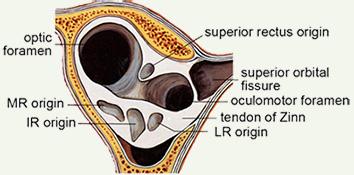  EOM contraction is reflected mostly in posterior crossection increases (Miller 1989) and consequently, it may be useful for measurements to extend to the origin. Further, generally available clinical scanners can visualize the orbital apex sufficiently well to use muscle origins as head-fixed referents, providing another reason to routinely capture the whole orbit. Muscle origins can be localized with about 2 mm longitudinal accuracy. Two measures of muscle size are generally useful. The first is an estimate of the total volume of the muscle, apart from the flat portion that wraps around the globe, which is difficult to visualize but also has little, and generally unchanging, volume. The second is the maximum crossection, and perhaps the longitudinal position of that maximum, which has been shown to move posteriorly with contraction (Miller 1989). Centerlines, reflecting muscle paths, are easily computed from 3D reconstructions. |